Not affiliated with or endorsed by the FCC, NCVEC, ARRL or any VEC. Questions are the NCVEC pools word for word (public domain); explanations are our own. Exam rules and fees can change: check with your VE team.
E9B: Antenna patterns and designs: azimuth and elevation patterns; gain as a function of pattern; antenna modeling
Group E9B of the Amateur Extra pool (2024–2028) has 11 active questions. One of them is on every Amateur Extra exam. Each is shown word for word; open it to see the correct answer and our explanation.
E9B01
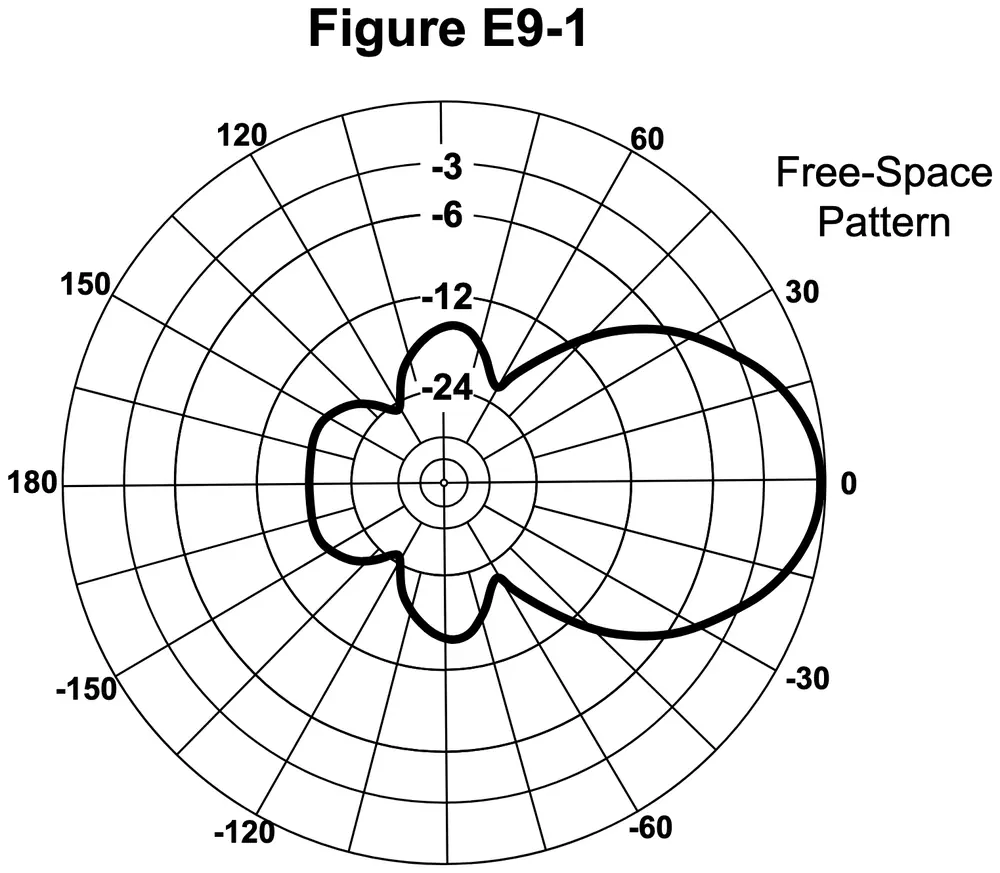
What is the 3 dB beamwidth of the antenna radiation pattern shown in Figure E9-1?
Figure E9-1
A 75 degrees
B 50 degrees
C 25 degrees
D 30 degrees
Show the answer and explanation
Correct answer: B. 50 degrees
Why B is right. B. The main lobe crosses the -3 dB ring at about 25 degrees on each side of 0 degrees, and 25 + 25 = 50 degrees.
Figure E9-1 is a circular plot. Angles run around the edge, with 0 degrees at the right. The outer ring is 0 dB, and inner rings are -3, -6, -12 and -24 dB. The big lobe points right, toward 0 degrees. Beamwidth is the angle between the two points where that lobe drops to -3 dB, the half-power points.
Why not C? 25 degrees is the angle on only one side of the peak; beamwidth spans both sides.
E9B02
What is the front-to-back ratio of the antenna radiation pattern shown in Figure E9-1?
Figure E9-1
A 36 dB
B 14 dB
C 24 dB
D 18 dB
Show the answer and explanation
Correct answer: D. 18 dB
Why D is right. D. The main lobe reaches 0 dB at 0 degrees, and the pattern at 180 degrees sits about 18 dB lower, between the -12 and -24 dB rings.
Front-to-back ratio compares the signal in the best direction with the signal straight behind. In Figure E9-1 the front is the big lobe on the right at 0 degrees. The back is on the left, at 180 degrees, where the outline sits partway between the -12 and -24 dB rings. Subtract the back reading from the front: 0 minus -18 is 18 dB.
Why not B? 14 dB is the drop toward the sides at 90 degrees, not toward the back.
E9B03
What is the front-to-side ratio of the antenna radiation pattern shown in Figure E9-1?
Figure E9-1
A 12 dB
B 24 dB
C 18 dB
D 14 dB
Show the answer and explanation
Correct answer: D. 14 dB
Why D is right. D. At 90 degrees, straight off the side, the pattern in Figure E9-1 sits about 14 dB below the 0 dB peak at the front.
Front-to-side ratio compares the forward peak with the signal at right angles to it. In Figure E9-1 the main lobe points to 0 degrees at the right. Look straight up or down the plot, at 90 and -90 degrees. Small side lobes there reach a little inside the -12 dB ring, about -14 dB.
Why not C? 18 dB is the drop toward the back at 180 degrees, not toward the side.
E9B04
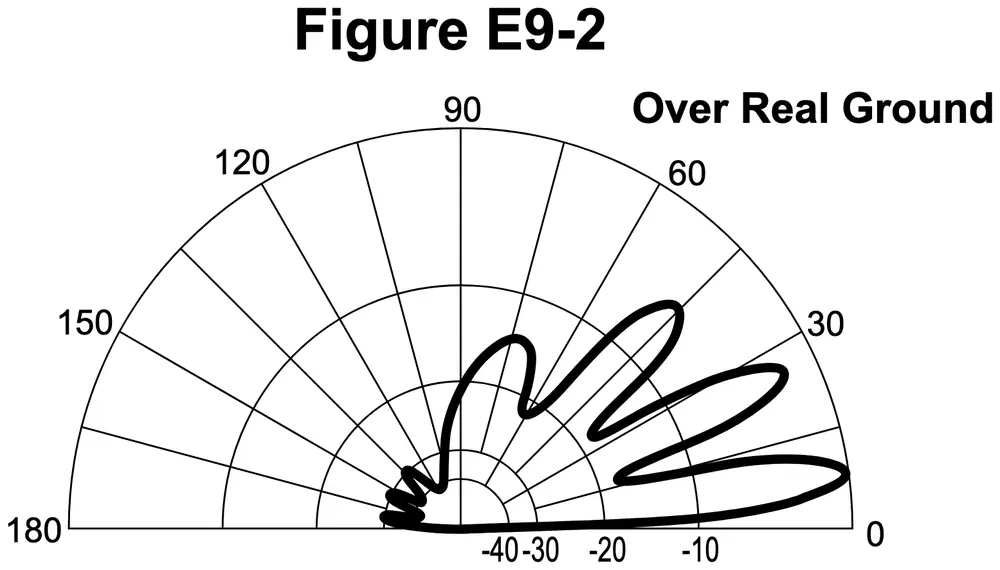
What is the front-to-back ratio of the radiation pattern shown in Figure E9-2?
Figure E9-2
A 15 dB
B 28 dB
C 3 dB
D 38 dB
Show the answer and explanation
Correct answer: B. 28 dB
Why B is right. B. The main lobe peaks at 0 dB toward the right, and the pattern toward 180 degrees on the left is near -28 dB, a 28 dB difference.
Figure E9-2 is a half circle. The right edge is 0 degrees, the top is 90 degrees, and the left edge is 180 degrees. Rings mark 0 dB at the outside, then -10, -20, -30 and -40 dB moving in. The strongest lobe hugs the right side. On the left, only small lobes appear, close to the -30 dB ring.
Why not D? 38 dB would put the rear lobes below the -30 dB ring, deeper than the plot shows.
E9B05
What type of antenna pattern is shown in Figure E9-2?
Figure E9-2
A Elevation
B Azimuth
C Near field
D Polarization
Show the answer and explanation
Correct answer: A. Elevation
Why A is right. A. Figure E9-2 is a half circle from horizon to overhead to horizon, over real ground, which is how elevation is shown.
An elevation pattern slices the radiation vertically. Its angles start at 0 degrees on the horizon, rise to 90 degrees straight up, and end at 180 degrees on the far horizon. Nothing goes below 0 because the ground is there. Figure E9-2 has that half-circle shape and the label Over Real Ground. An azimuth pattern is a full circle seen from above.
Why not B? An azimuth pattern is a full 360-degree circle around the antenna, not a half circle above ground.
E9B06
What is the elevation angle of peak response in the antenna radiation pattern shown in Figure E9-2?
Figure E9-2
A 45 degrees
B 75 degrees
C 7.5 degrees
D 25 degrees
Show the answer and explanation
Correct answer: C. 7.5 degrees
Why C is right. C. The strongest lobe in Figure E9-2 touches the 0 dB outer ring at a very low angle, about 7.5 degrees above the horizon.
In Figure E9-2, 0 degrees is the horizon at the right and 30 degrees is the first labeled spoke above it. The longest lobe sits low, between 0 and 30, about a quarter of the way up. Other lobes point higher, but they are shorter and do not reach the outer ring. A low peak angle like this favors long-distance contacts.
Why not D? Near 25 degrees there is a second, weaker lobe, not the peak.
E9B07
What is the difference in radiated power between a lossless antenna with gain and an isotropic radiator driven by the same power?
A The power radiated from the directional antenna is increased by the gain of the antenna
B The power radiated from the directional antenna is stronger by its front-to-back ratio
C They are the same
D The power radiated from the isotropic radiator is 2.15 dB greater than that from the directional antenna
Show the answer and explanation
Correct answer: C. They are the same
Why C is right. C. A lossless antenna radiates all the power fed to it; gain only reshapes where that power goes.
Gain is not extra power. A directional antenna takes power away from some directions and puts it into others. Its strongest direction looks stronger than an isotropic radiator, and its weak directions look weaker. Add up the power over every direction and both radiate the same total, because neither one loses any.
Why not A? Gain raises the signal in the favored direction only; the total radiated power does not grow.
E9B08
What is the far field of an antenna?
A The region of the ionosphere where radiated power is not refracted
B The region where radiated power dissipates over a specified time period
C The region where radiated field strengths are constant
D The region where the shape of the radiation pattern no longer varies with distance
Show the answer and explanation
Correct answer: D. The region where the shape of the radiation pattern no longer varies with distance
Why D is right. D. Far enough from the antenna, the pattern keeps the same shape at any distance; only its overall strength falls off.
Close to an antenna, stored energy and fields from different parts of it mix in complicated ways. That close-in region is the near field. Several wavelengths out, the waves settle into a fixed shape. From there on, moving farther away lowers the signal everywhere by the same amount. That outer region is the far field, where patterns are measured.
Why not C? Field strength keeps falling with distance in the far field; it is the shape, not the strength, that stays constant.
E9B09
What type of analysis is commonly used for modeling antennas?
A Graphical analysis
B Method of Moments
C Mutual impedance analysis
D Calculus differentiation with respect to physical properties
Show the answer and explanation
Correct answer: B. Method of Moments
Why B is right. B. Antenna modeling programs mostly use the Method of Moments, which solves for current along wires broken into small pieces.
Exact equations for a real antenna are too hard to solve by hand. The Method of Moments turns the problem into a large set of simple equations a computer can handle. Once the current on every piece is known, the program works out the pattern, gain and feed point impedance. Many popular ham modeling programs are built on this method.
Why not C? Mutual impedance is one effect the model accounts for, but it is not the name of the overall method.
E9B10
What is the principle of a Method of Moments analysis?
A A wire is modeled as a series of segments, each having a uniform value of current
B A wire is modeled as a single sine-wave current generator
C A wire is modeled as a single sine-wave voltage source
D A wire is modeled as a series of segments, each having a distinct value of voltage across it
Show the answer and explanation
Correct answer: A. A wire is modeled as a series of segments, each having a uniform value of current
Why A is right. A. The Method of Moments chops each wire into short segments and treats the current on each one as a single, even value.
Current along a real wire changes smoothly from point to point. If the segments are short enough, treating the current as constant on each one is close to the truth. The program then solves for all the segment currents at once, including how each segment affects the others. The fields from those currents give the pattern.
Why not D? The method solves for a current on each segment, not a separate voltage across each one.
E9B11
What is a disadvantage of decreasing the number of wire segments in an antenna model below 10 segments per half-wavelength?
A Ground conductivity will not be accurately modeled
B The resulting design will favor radiation of harmonic energy
C The computed feed point impedance may be incorrect
D The antenna will become mechanically unstable
Show the answer and explanation
Correct answer: C. The computed feed point impedance may be incorrect
Why C is right. C. With too few segments, the even-current steps no longer follow the real current closely, so the impedance result can be wrong.
Each segment has one current value. Current varies a lot along a half-wavelength, so it takes enough segments to trace that shape. Below about 10 per half-wavelength, the stair-step guess is too coarse. Feed point impedance is especially sensitive, because it depends on the current right at the feed segment.
Why not D? A computer model has no effect on how sturdy the real antenna is.