Not affiliated with or endorsed by the FCC, NCVEC, ARRL or any VEC. Questions are the NCVEC pools word for word (public domain); explanations are our own. Exam rules and fees can change: check with your VE team.
E9G: The Smith chart
Group E9G of the Amateur Extra pool (2024–2028) has 11 active questions. One of them is on every Amateur Extra exam. Each is shown word for word; open it to see the correct answer and our explanation.
E9G01
Which of the following can be calculated using a Smith chart?
A Impedance along transmission lines
B Radiation resistance
C Antenna radiation pattern
D Radio propagation
Show the answer and explanation
Correct answer: A. Impedance along transmission lines
Why A is right. A. A Smith chart maps every possible impedance, and moving around it follows how impedance changes along a transmission line.
Plot a load's impedance on the chart, then rotate around the center by the length of line in wavelengths. The new point shows the impedance at that spot on the line. This replaces pages of complex-number math with a compass and a ruler. Radiation patterns and propagation are outside what the chart describes.
Why not C? A radiation pattern describes direction in space, which the Smith chart does not show.
E9G02
What type of coordinate system is used in a Smith chart?
A Voltage circles and current arcs
B Resistance circles and reactance arcs
C Voltage chords and current chords
D Resistance lines and reactance chords
Show the answer and explanation
Correct answer: B. Resistance circles and reactance arcs
Why B is right. B. The Smith chart is built from circles of constant resistance and arcs of constant reactance, together locating any impedance.
An impedance has two parts: resistance and reactance. On a Smith chart, each resistance value is a circle, and each reactance value is an arc. Where a resistance circle crosses a reactance arc is the point for that impedance. Inductive reactances sit in the upper half and capacitive ones in the lower half.
Why not A? The chart's grid plots impedance parts, not voltage and current.
E9G03
Which of the following is often determined using a Smith chart?
A Beam headings and radiation patterns
B Satellite azimuth and elevation bearings
C Impedance and SWR values in transmission lines
D Point-to-point propagation reliability as a function of frequency
Show the answer and explanation
Correct answer: C. Impedance and SWR values in transmission lines
Why C is right. C. Because it tracks impedance along a line, the Smith chart also gives the SWR at any point, from the distance to its center.
The exact center of the chart is a perfect match, SWR 1 to 1. The farther a point lies from the center, the greater the mismatch and the higher the SWR. On a lossless line, moving along the line keeps you the same distance from center, so the SWR stays the same while the impedance changes.
Why not A? Beam headings and patterns are directions in space, not impedances on a line.
E9G04
What are the two families of circles and arcs that make up a Smith chart?
A Inductance and capacitance
B Reactance and voltage
C Resistance and reactance
D Voltage and impedance
Show the answer and explanation
Correct answer: C. Resistance and reactance
Why C is right. C. One family marks constant resistance and the other marks constant reactance, the two parts of any impedance.
The resistance circles all touch at the far right edge of the chart and get smaller as resistance rises. The reactance arcs also start from that point and curve out to the outer circle. Reading where one circle and one arc meet gives a complete impedance.
Why not A? Inductance and capacitance are component values; the chart plots reactance, which also depends on frequency.
E9G05
Which of the following is a common use for a Smith chart?
A Determine the length and position of an impedance matching stub
B Determine the impedance of a transmission line, given the physical dimensions
C Determine the gain of an antenna given the physical and electrical parameters
D Determine the loss/100 feet of a transmission line, given the velocity factor and conductor materials
Show the answer and explanation
Correct answer: A. Determine the length and position of an impedance matching stub
Why A is right. A. Designing a matching stub means finding the right spot on the line and the right stub length, both easy to read off a Smith chart.
First, rotate from the load toward the generator until you reach a point whose resistance part (or, for a parallel stub, conductance part) matches the line. Note that distance. Then find the stub length whose reactance cancels the leftover reactance at that point. Both answers come out in wavelengths, ready to convert to meters.
Why not B? A line's characteristic impedance comes from its conductor sizes and spacing, which the chart does not calculate.
E9G06
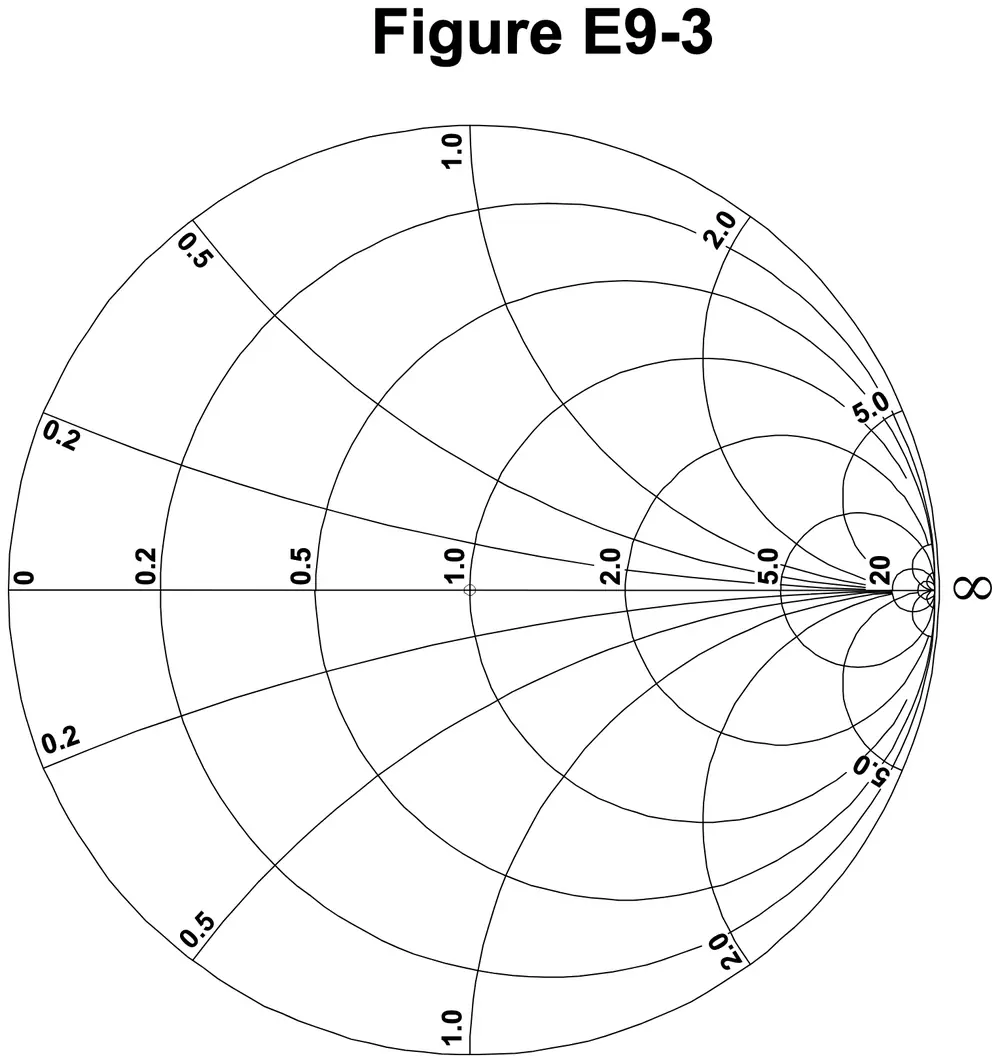
On the Smith chart shown in Figure E9-3, what is the name for the large outer circle on which the reactance arcs terminate?
Figure E9-3
A Prime axis
B Reactance axis
C Impedance axis
D Polar axis
Show the answer and explanation
Correct answer: B. Reactance axis
Why B is right. B. On the outer circle the resistance is zero, so every point there is pure reactance; that is why it is called the reactance axis.
Figure E9-3 is a large circle filled with smaller circles and curved lines. The large outer circle is where all the curved reactance arcs end, and its edge is marked with reactance values like 0.2, 0.5, 1.0, 2.0 and 5.0. Points on that edge have no resistance at all.
Why not C? Impedance covers the whole chart, so no single circle is the impedance axis.
E9G07
On the Smith chart shown in Figure E9-3, what is the only straight line shown?
Figure E9-3
A The reactance axis
B The current axis
C The voltage axis
D The resistance axis
Show the answer and explanation
Correct answer: D. The resistance axis
Why D is right. D. The one straight line runs across the middle, where reactance is zero, so every point on it is pure resistance.
In Figure E9-3, a horizontal line crosses the chart through its center. It is marked from 0 at the left edge through 0.2, 0.5, 1.0, 2.0, 5.0 and 20, with the infinity sign at the right edge. Above that line, reactance is inductive; below it, capacitive. On the line itself, there is only resistance.
Why not A? The reactance axis is the curved outer circle, not a straight line.
E9G08
How is a Smith chart normalized?
A Reassign the reactance axis with resistance values
B Reassign the resistance axis with reactance values
C Reassign the prime center’s impedance value
D Reassign the prime center to the reactance axis
Show the answer and explanation
Correct answer: C. Reassign the prime center’s impedance value
Why C is right. C. Normalizing assigns a real impedance, often 50 ohms, to the center point marked 1.0, so all chart values scale from it.
The chart's labels are ratios, not ohms. To use it with 50-ohm line, divide each impedance by 50 before plotting. A 100-ohm load becomes 2.0; a 25-ohm load becomes 0.5. Multiply by 50 again to read results back in ohms. The same chart works for 75-ohm or 300-ohm systems by choosing a different value.
Why not A? The resistance and reactance axes keep their roles; normalizing only rescales the numbers.
E9G09
What third family of circles is often added to a Smith chart during the process of designing impedance matching networks?
A Constant-SWR circles
B Transmission line length circles
C Coaxial-length circles
D Radiation-pattern circles
Show the answer and explanation
Correct answer: A. Constant-SWR circles
Why A is right. A. Constant-SWR circles are centered on the chart's middle, and each one marks every impedance that gives the same SWR.
On a lossless line, moving along the line keeps the SWR fixed. On the chart, that motion is a circle around the center. Drawing that circle shows every impedance the line will present along its length. Designers use it to find where the circle crosses a useful resistance for matching.
Why not B? Line length is read from the wavelength scale around the rim, not from added circles.
E9G10
What do the arcs on a Smith chart represent?
A Frequency
B SWR
C Points with constant resistance
D Points with constant reactance
Show the answer and explanation
Correct answer: D. Points with constant reactance
Why D is right. D. Each arc connects all impedances with the same reactance value, whatever their resistance.
On the Smith chart, the full circles are constant resistance and the arcs are constant reactance. Arcs above the center line are inductive and those below are capacitive. Follow one arc and only the resistance changes. Each arc meets the outer circle at its labeled reactance value.
Why not C? Constant resistance is shown by the full circles, not the arcs.
E9G11
In what units are the wavelength scales on a Smith chart calibrated?
A In fractions of transmission line electrical frequency
B In fractions of transmission line electrical wavelength
C In fractions of antenna electrical wavelength
D In fractions of antenna electrical frequency
Show the answer and explanation
Correct answer: B. In fractions of transmission line electrical wavelength
Why B is right. B. The rim scales count distance along the feed line in fractions of its electrical wavelength, so they work for any line.
One full trip around a Smith chart equals a half wavelength of line, because impedance repeats every half wave. The scales around the edge mark that distance from 0 to 0.5 wavelength. Using electrical wavelength means the velocity factor is already included. Convert to meters only at the end.
Why not C? The scales measure the transmission line, not the antenna itself.